From Formal Model to Sequence Diagram: TLA+ as a Machine-Readable Specification
In a previous post I argued that machine-readable specifications are the foundation for AI-augmented hardware design. This post digs into a specific tool for that job: TLA+ and its procedural front-end PlusCal.
What TLA+ Brings to Hardware Architecture
TLA+ (Temporal Logic of Actions) is a formal specification language for describing concurrent and distributed systems. PlusCal is a pseudocode-like layer that compiles down to TLA+, making it accessible to engineers who are more comfortable with imperative algorithms than with temporal logic.
The key properties that make TLA+/PlusCal valuable for fabric and protocol architecture:
- Exhaustive model checking. The TLC model checker explores every reachable state of the specification, proving invariants (e.g. no deadlock, mutual exclusion, ordering guarantees) or producing a concrete counter-example trace when a property is violated.
- Deadlock analysis. TLC can detect deadlocked states — situations where the system has not terminated but no process can take a step. For a fabric with credit-based flow control, this catches credit leaks and circular dependencies that are nearly impossible to find by inspection.
- Precise enough for machines, readable enough for humans. A TLA+ spec is simultaneously a mathematical proof artifact and a document that an architect can review for intent. It is also structured enough for an LLM to consume without ambiguity — unlike prose.
The Visualization Problem
There is a catch. TLC’s output is purely textual. When the model checker finds a counter-example — a sequence of states that violates an invariant or leads to deadlock — the output looks like a wall of nested records:
1
2
3
4
5
6
7
8
9
10
11
State 1: <Initial predicate>
/\ cache = (p1 :> "I" @@ p2 :> "I")
/\ bus = <<>>
/\ memory = [addr1 |-> 0]
/\ _seqDiagramTrace = <<>>

State 2: p1 issues ReadReq
/\ cache = (p1 :> "IS_D" @@ p2 :> "I")
/\ bus = <<[msg |-> "ReadReq", src |-> "p1", dst |-> "Memory", ch |-> "req"]>>
/\ _seqDiagramTrace = << [msg |-> "ReadReq", src |-> "p1", dst |-> "Memory", ch |-> "req"] >>
...
For a protocol architect, the natural visualization of this trace is a sequence diagram — it immediately shows who sent what, to whom, and in what order. But drawing sequence diagrams by hand is exactly the kind of busywork that slows down the specification process:
- Architects spend hours in Visio drawing message flows that are already fully described by the formal model.
- Diagrams are out of date the moment they are published — the model evolves, but nobody updates the Visio file.
- It is nearly impossible to draw all combinations manually. A four-processor MESI protocol has hundreds of interesting interleavings. No one is going to draw each one by hand.
Generating Sequence Diagrams from TLC Traces
To close this gap, I contributed an enhancement to the TLA+ VS Code extension that automatically generates PlantUML sequence diagrams from TLC model-checking traces.
How It Works
The flow is fully automatic — no commands to invoke, no buttons to click:
flowchart LR
    A["TLA+ / PlusCal<br/>Specification"] --> B["TLC<br/>Model Checker"]
    B --> C["Trace Output<br/>(textual states)"]
    C --> D["Trace Parser"]
    D --> E["PlantUML<br/>Generator"]
    E --> F[".puml File<br/>(opens in editor)"]
    F --> G["PlantUML Renderer<br/>(preview as SVG)"]
- The user runs TLC from VS Code as usual.
- The extension captures TLC’s raw stdout.
- After TLC completes, a trace parser extracts a designated trace variable (by default
_seqDiagramTrace) from the output. This variable is a TLA+ sequence of records, each withmsg(message label),src(source participant),dst(destination participant), and an optionalch(channel, for color grouping). - A PlantUML generator converts the parsed messages into
.pumltext — declaring participants in first-appearance order, assigning colors per channel from an 8-color palette, and rendering arrows with autonumbered labels. - The generated
.pumlopens automatically in a side-by-side editor tab, ready for preview with any PlantUML renderer extension.
The extension generates PlantUML text, not rendered images. This avoids bundling a 20 MB plantuml.jar and lets users choose their preferred renderer. The contribution is the generation engine.
The Trace Variable Convention
The only requirement on the TLA+ specification is that it maintain a sequence variable containing the message history. In PlusCal, this typically looks like:
1
2
_seqDiagramTrace := Append(_seqDiagramTrace,
    [msg |-> "ReadReq", src |-> self, dst |-> "Memory", ch |-> "req"]);
Each record has:
| Field | Required | Purpose |
|---|---|---|
msg | Yes | Arrow label (e.g. “ReadReq”, “DataResp”) |
src | Yes | Source participant |
dst | Yes | Destination participant |
ch | No | Channel name — messages on the same channel share a color |
If ch is omitted, each distinct msg type gets its own color automatically. The variable name is configurable via a VS Code setting.
Concurrent Region Detection
The most interesting part of the generator is its handling of concurrency. When TLC produces multiple terminal traces (via exhaustive state-space exploration), the generator compares all traces against a canonical first trace to identify:
- Fixed positions — messages that appear at the same index in every trace. These are sequential steps.
- Variant regions — contiguous ranges where message order differs across traces. These represent true concurrency.
Variant regions are recursively split into independent concurrent chains — subsets whose internal order is stable but whose relative ordering with other subsets varies. The result is rendered using PlantUML’s par / group constructs with distinct colors:
1
2
3
4
5
6
7
8
par Concurrent Chains
  group #FF6B6B Chain 1
    p1 -> Memory : ReadReq
  end
  group #00BBF9 Chain 2
    p2 -> Memory : ReadReq
  end
end
This means you see not just a trace but the structure of the concurrency — which messages are ordered and which are independent.
Color Coding
Messages are color-coded by channel (or by message type if no channel is specified) using an 8-color palette — red, blue, green, orange, purple, teal, deep-orange, indigo. When an explicit ch field is present, the channel name is annotated below the arrow label in a smaller font. Concurrent region boxes use a separate 6-color palette.
The visual result is that you can instantly distinguish traffic on different channels (request vs. data vs. snoop, for example) without reading every label.
Example: Snoopy-Bus MESI Protocol
Here is a screenshot of a sequence diagram generated from a TLA+ specification of a textbook snoopy-bus MESI cache-coherence protocol. The model describes processors issuing reads and writes, the bus arbitrating between them, and caches transitioning through Modified, Exclusive, Shared, and Invalid states.
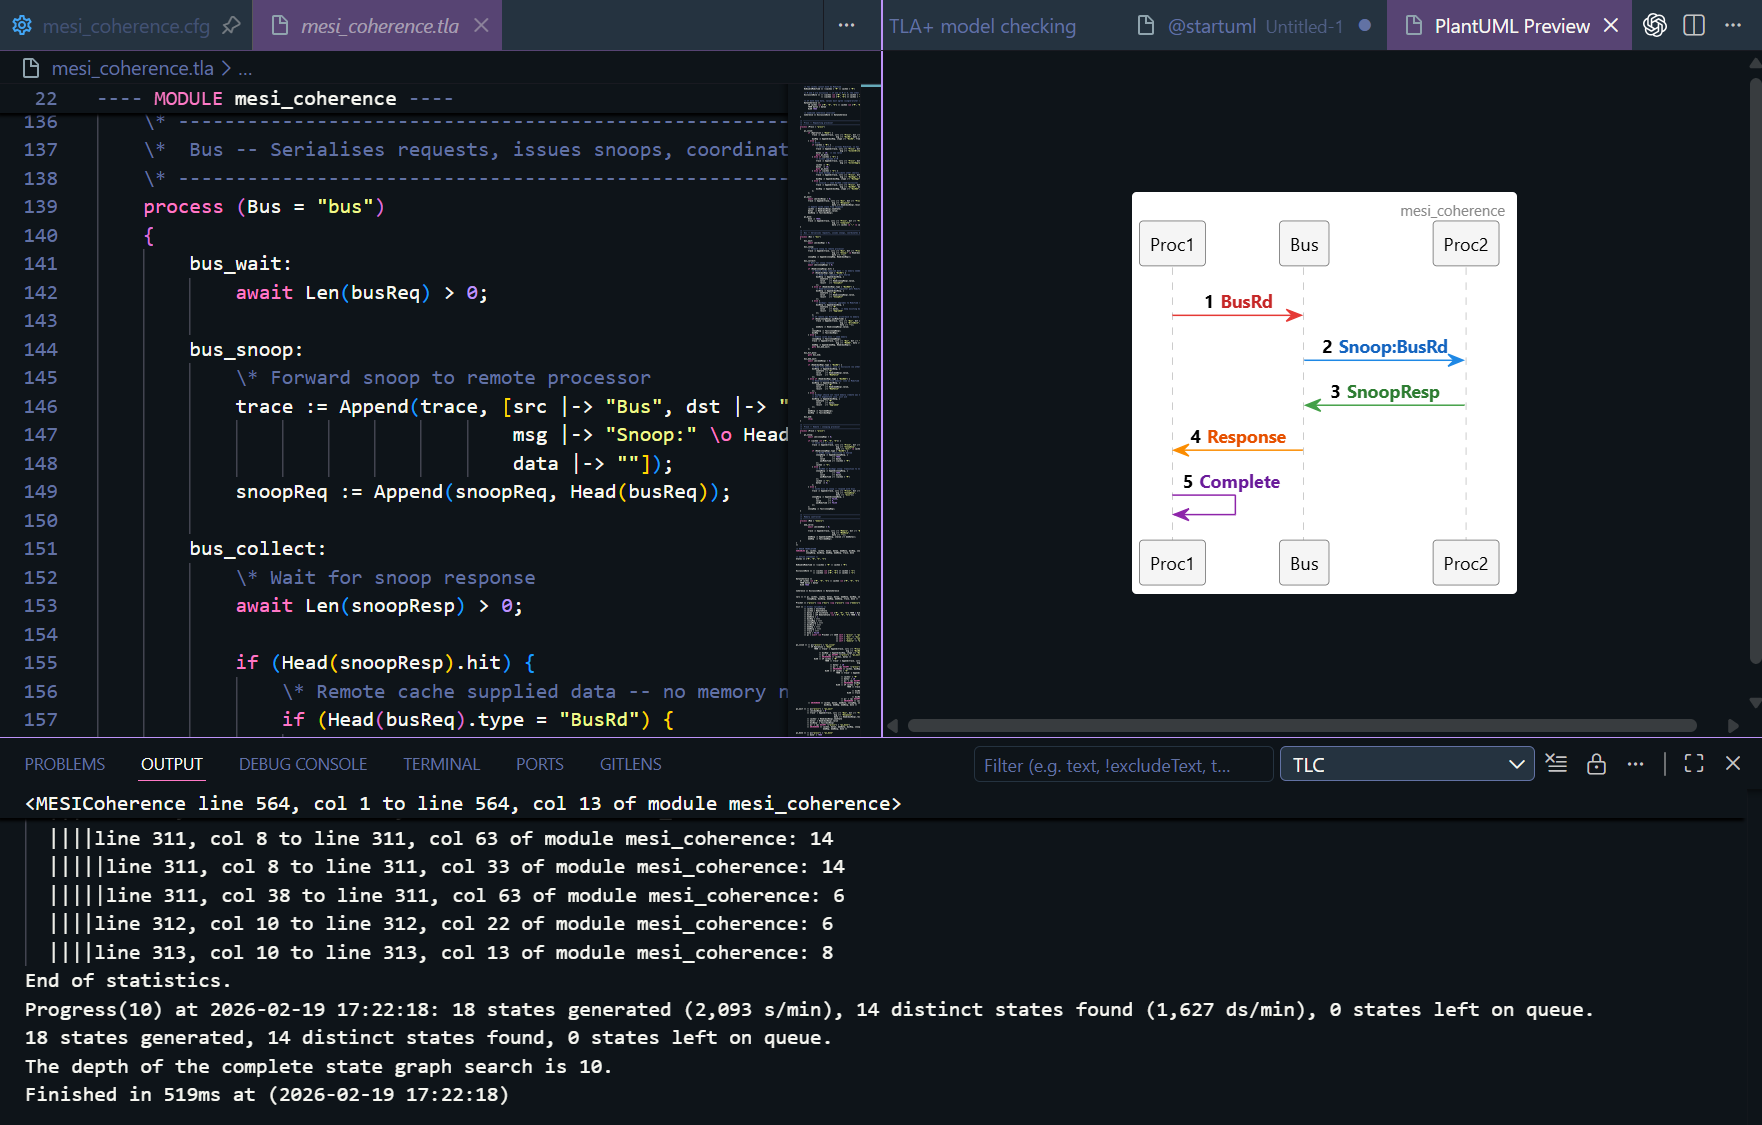 Sequence diagram auto-generated from TLC output. Each arrow is a protocol message; colors distinguish channels (request, data, snoop). Autonumbering shows the global message order.
This diagram was not drawn by hand. It was generated directly from the TLC model checker’s trace output — the formal model is the documentation. If the model changes, re-running TLC produces an updated diagram automatically.
The Iterative Modeling Loop
The real payoff is in how this changes the specification workflow:
flowchart TD
    A["Write / Edit<br/>PlusCal Spec"] --> B["Run TLC<br/>(Ctrl+Shift+P)"]
    B --> C{"Invariant<br/>Holds?"}
    C -- "Yes" --> D["Spec is Correct<br/>(for this state space)"]
    C -- "No" --> E["Counter-example<br/>Sequence Diagram<br/>Opens Automatically"]
    E --> F["Inspect Diagram:<br/>Identify Root Cause"]
    F --> A
    D --> G["Diagrams Serve as<br/>Auto-Generated<br/>Documentation"]
Without visualization, the loop is: edit spec → run TLC → read 200 lines of textual state → squint → maybe understand the bug → edit spec. With automatic diagram generation, the loop becomes: edit spec → run TLC → look at the picture → see the bug → fix it.
The time from “TLC found a violation” to “I understand what went wrong” drops from minutes to seconds. Over the course of a multi-week specification effort, that compounds into days of saved time — and the diagrams are documentation artifacts you keep.
Why This Matters for Fabric Architecture
A fabric specification involves exactly the kind of multi-agent, message-passing, ordering-sensitive behavior that TLA+ was designed for. The message types are protocol-specific (requests, completions, snoops, credits), the participants are fabric agents (requesters, completers, home agents, snoop filters), and the invariants are the ordering rules and deadlock-freedom properties the fabric must guarantee.
By writing the specification in TLA+/PlusCal:
- The model checker proves properties that simulation would take years to cover.
- Counter-examples are visualized automatically as sequence diagrams that the entire team can read.
- The diagrams stay in sync with the model because they are generated from it — not maintained separately.
- The spec is machine-readable — it can feed directly into AI-augmented RTL generation and testbench synthesis pipelines.
Architects no longer have to choose between a formal model (for correctness) and pretty diagrams (for communication). They get both from the same source.